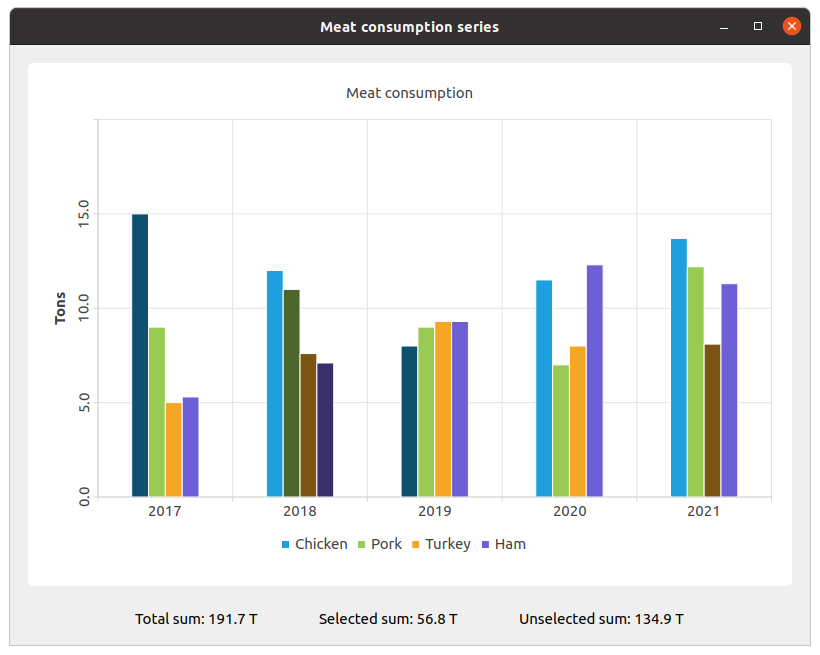
The example shows how to use a selection feature for the bar chart.
The example shows changing the color and state of bars using the selection feature.
Running the Example
To run the example from Qt Creator, open the Welcome mode and select the example from Examples. For more information, visit Building and Running an Example.
Using setBarSelected()
We create the sets and fill them with the data. Then we create a series and append data to it.
QBarSet *setChicken = Utilities::createChickenSet();
QBarSet *setPork = Utilities::createPorkSet();
QBarSet *setTurkey = Utilities::createTurkeySet();
QBarSet *setHam = Utilities::createHamSet();
qreal totalSum = setChicken->sum() + setPork->sum() + setTurkey->sum() + setHam->sum();
QList<QBarSet *> setList = QList<QBarSet *>{setChicken, setPork, setTurkey, setHam};

QBarSeries *series = new QBarSeries();
series->append(setList);
We create the chart and add series to it. Also, we add a title to the chart, set animation for the chart, and align the legend.
QChart *chart = new QChart();
chart->addSeries(series);
chart->setTitle(QCoreApplication::tr("Meat consumption"));
chart->setAnimationOptions(QChart::SeriesAnimations);
chart->legend()->setVisible(true);
chart->legend()->setAlignment(Qt::AlignBottom);
Here we set the color for the selected bars.
for (QBarSet *barSet : series->barSets())
    barSet->setSelectedColor(barSet->brush().color().darker());
Next step is adding axes: QBarCategoryAxis for years of measurements and QValueAxis for values range.
QStringList categories = Utilities::createYearCategories();
QBarCategoryAxis *axisX = new QBarCategoryAxis();
axisX->setCategories(categories);
chart->addAxis(axisX, Qt::AlignBottom);
series->attachAxis(axisX);

QValueAxis *axisY = new QValueAxis();
axisY->setRange(0, 20);
axisY->setTitleText(QCoreApplication::tr("Tons"));
axisY->setLabelsAngle(-90);
axisY->setTitleVisible(true);
chart->addAxis(axisY, Qt::AlignLeft);
series->attachAxis(axisY);
Then we add the chart view to put the chart in.
QChartView *chartView = new QChartView(chart);
chartView->setRenderHint(QPainter::Antialiasing);
Here we create a widget for labels of values of selected and unselected bars.
QWidget *labelWidget = new QWidget(&mainWindow);
QHBoxLayout *labelLayout = new QHBoxLayout(labelWidget);
labelLayout->setAlignment(Qt::AlignCenter);

QLabel *totalSumLabel = new QLabel(QCoreApplication::tr("Total sum: %1 T").arg(totalSum));
labelLayout->addWidget(totalSumLabel);
totalSumLabel->setContentsMargins(0, 0, 54, 0);

QLabel *selectedSumLabel = new QLabel(QCoreApplication::tr("Selected sum: 0 T"));
labelLayout->addWidget(selectedSumLabel);

QLabel *unselectedSumLabel = new QLabel(QCoreApplication::tr("Unselected sum: %1 T").arg(totalSum));
labelLayout->addWidget(unselectedSumLabel);
unselectedSumLabel->setContentsMargins(54, 0, 0, 0);
We connect selecting of a specific bar with labels of values using a lambda. set->toggleSelection({index}) sets the bar selected.
QObject::connect(series, &QAbstractBarSeries::clicked, series, [=](int index, QBarSet *set) {
set->toggleSelection({index});
qreal selectedSum = 0.;
for (int i = 0; i < setList.size(); ++i) {
auto selectedIndices = setList.at(i)->selectedBars();
for (int k = 0; k < selectedIndices.size(); ++k)
selectedSum += setList.at(i)->at(selectedIndices.at(k));
}
selectedSumLabel->setText(QCoreApplication::tr("Selected sum: %1 T").arg(selectedSum));
qreal unselectedSum = totalSum - selectedSum < 0 ? 0. : totalSum - selectedSum;
unselectedSumLabel->setText(
QCoreApplication::tr("Unselected sum: %1 T")
.arg(unselectedSum)
);
});
Finally, we create the main widget and add other layouts to it and run the application.
QWidget *mainWidget = new QWidget(&mainWindow);
QVBoxLayout *mainLayout = new QVBoxLayout(mainWidget);

mainLayout->addWidget(chartView);
mainLayout->addWidget(labelWidget);

mainWindow.setCentralWidget(mainWidget);
mainWindow.resize(800, 600);

mainWindow.show();
return a.exec();
Example project @ code.qt.io


